Discrete or continuous data are two common types of data used in math, science, and daily life. Knowing the difference helps you collect and understand information correctly.
Many people confuse these terms because both describe numbers. However, they work in different ways.
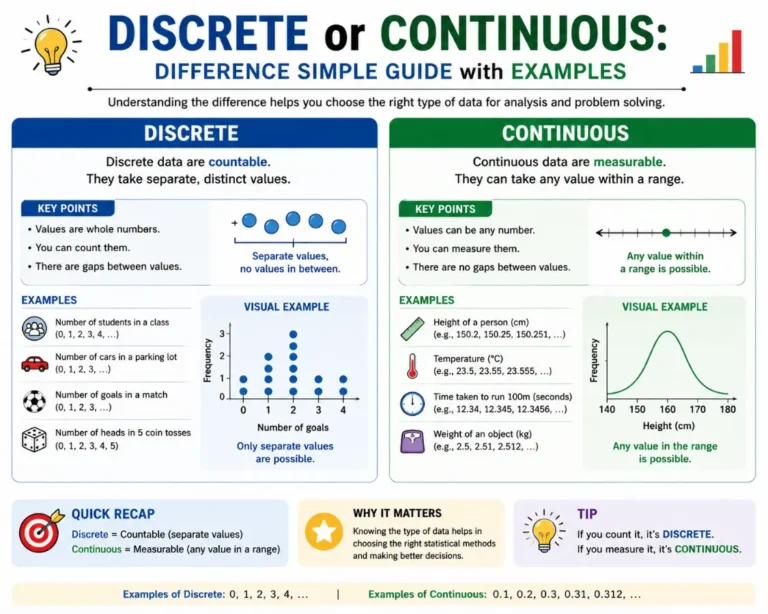
Discrete data counts separate values. Continuous data measures values that can change smoothly.
For example, the number of students in a class is discrete. A person’s height is continuous.
Understanding these concepts makes statistics easier. It also helps students, researchers, and businesses make better decisions.
In this guide, you will learn the meaning of discrete and continuous data, see real-life examples, and discover common mistakes to avoid.
Quick Summary Box
- Discrete data contains separate and countable values.
- Continuous data contains measurable values within a range.
- Discrete values cannot have fractions between counts.
- Continuous values can include decimals.
- Number of books is discrete data.
- Weight and height are continuous data.
- Both types help organize and analyze information.
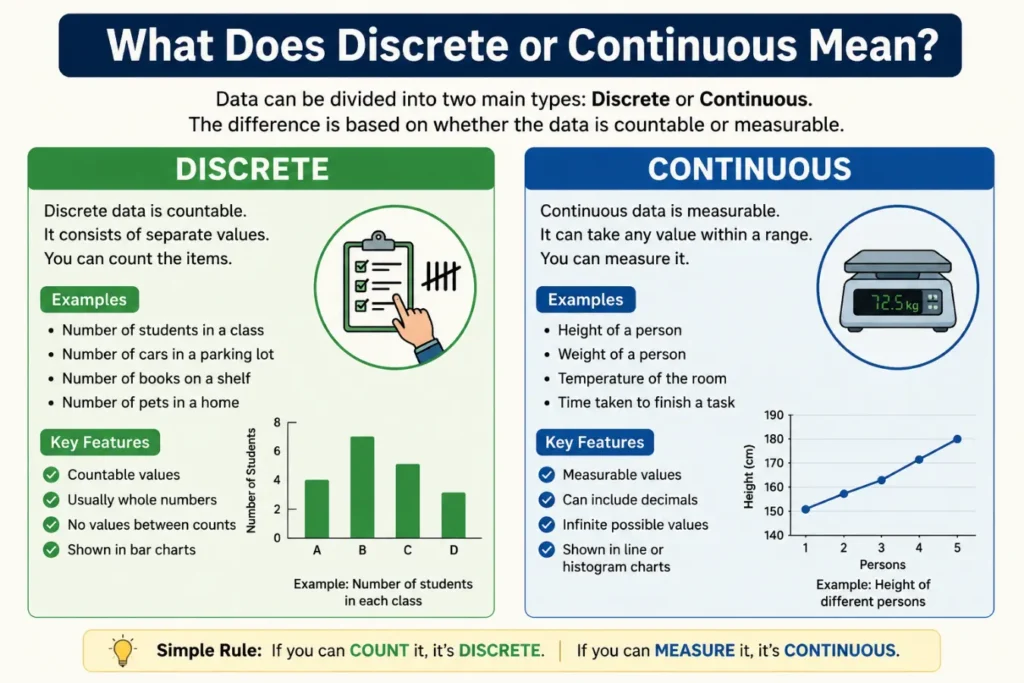
What Does Discrete or Continuous Mean?
Discrete and continuous are two categories of numerical data.
Data
Discrete data consists of values you can count.
Examples:
- Number of cars
- Number of pets
- Number of students
You cannot have 2.5 students or 3.7 cars.
Continuous Data
Continuous data consists of values you measure.
Examples:
- Height
- Weight
- Temperature
- Time
These values can include decimals and fractions.
Discrete Data Explained in Simple Words
Discrete data comes from counting items.
Each value stands alone. There are gaps between numbers.
Examples:
- 5 apples
- 12 houses
- 3 children
You move from one whole number to another.
Characteristics of Discrete Data
- Countable values
- Usually whole numbers
- No values between counts
- Often shown in bar charts
Continuous Data Explained in Simple Words
Continuous data comes from measurements.
Values can change smoothly and have many possibilities.
Examples:
- 165.2 cm height
- 72.8 kg weight
- 20.6°C temperature
Continuous values can be very precise.
Characteristics of Continuous Data
- Measured values
- Includes decimals
- Infinite possible values
- Often shown in line graphs or histograms
Discrete vs Continuous Data Comparison Table
| Feature | Discrete Data | Continuous Data |
|---|---|---|
| Meaning | Counted values | Measured values |
| Numbers | Usually whole numbers | Whole numbers and decimals |
| Gaps between values | Yes | No |
| Examples | Number of students | Height and weight |
| Collection method | Counting | Measuring |
| Graph type | Bar chart | Histogram or line graph |
Real-Life Examples of Discrete Data
Here are common examples:
At School
- Number of students
- Number of classrooms
- Number of teachers
At Home
- Number of chairs
- Number of pets
- Number of televisions
In Business
- Number of customers
- Number of products sold
- Number of employees
Real-Life Examples of Continuous Data
Continuous data appears everywhere.
Health
- Blood pressure
- Body weight
- Height
Weather
- Temperature
- Rainfall
- Wind speed
Sports
- Running time
- Distance covered
- Speed
How to Identify Whether Data Is Discrete or Continuous
Ask yourself these questions:
Can I Count It?
If yes, it is probably discrete.
Example:
- Number of pencils
Can I Measure It?
If yes, it is probably continuous.
Example:
- Length of a pencil
A simple rule is:
Count = Discrete
Measure = Continuous
Why Understanding Discrete and Continuous Data Matters
Knowing the difference helps in many areas.
Statistics
Correct data leads to accurate results.
Science
Researchers choose the right methods.
Business
Companies analyze customer behavior.
Education
Students solve math problems correctly.
Healthcare
Doctors track patient measurements accurately.
Common Mistakes People Make
Many people confuse these two types of data.
Mistake 1: Thinking All Numbers Are Continuous
Not every number is continuous.
Example:
Number of children is discrete.
Mistake 2: Ignoring Decimals
Continuous data often includes decimal values.
Mistake 3: Mixing Counting and Measuring
Counting gives discrete data.
Measuring gives continuous data.
Tips and Tricks to Remember the Difference
Use these easy memory tricks.
Remember “Count vs Measure”
- Count = Discrete
- Measure = Continuous
Think About Fractions
Can the value be 2.5?
- Yes → Continuous
- No → Discrete
Use Everyday Objects
Books = Discrete
Weight = Continuous
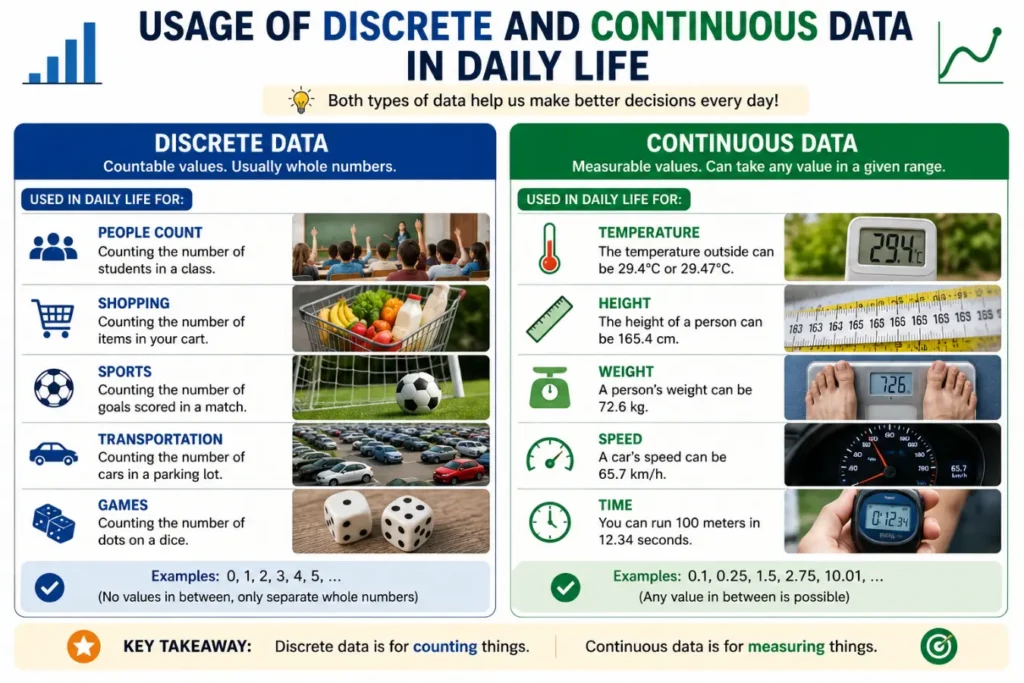
Usage of Discrete and Continuous Data in Daily Life
You use these concepts every day.
Shopping
Number of items purchased is discrete.
Total weight of vegetables is continuous.
Fitness
Number of push-ups is discrete.
Body weight is continuous.
Travel
Number of passengers is discrete.
Travel time is continuous.
Synonyms and Related Terms
Related Search Terms
- Discrete data definition
- Continuous data definition
- Difference between discrete and continuous
- Countable data
- Measured data
- Quantitative data types
- Discrete vs continuous variables
- Statistics data examples
Semantic Keywords
- Numerical data
- Data classification
- Statistical variables
- Measurement data
- Count data
- Data analysis
Discrete and Continuous Variables
Variables also follow the same idea.
Discrete Variables
Examples:
- Number of siblings
- Number of goals scored
Continuous Variables
Examples:
- Age
- Height
- Speed
Variables describe characteristics that can change.
Expert Insight: Why This Topic Is Important
Experts in statistics stress the importance of data classification.
Choosing the wrong type can lead to poor analysis.
Businesses depend on accurate data to make decisions.
Scientists use these concepts to improve research quality.
Students who understand discrete and continuous data often perform better in mathematics and statistics.
Learning this topic builds a strong foundation for future studies.
(FAQs)
What is the difference between discrete and continuous data?
Discrete data is counted. Continuous data is measured.
Is age discrete or continuous?
Age is generally continuous because it can include fractions of time.
Is height discrete or continuous?
Height is continuous because it is measured.
Is the number of students discrete?
Yes. Students are counted using whole numbers.
Can continuous data contain decimals?
Yes. Continuous values often include decimals.
Can discrete data have fractions?
No. Discrete data usually uses separate countable values.
Which graph is used for discrete data?
Bar charts are commonly used.
Which graph is used for continuous data?
Histograms and line graphs are common choices.
Conclusion
Understanding discrete or continuous data is important in mathematics and everyday life. Discrete data comes from counting separate items. Continuous data comes from measuring values that can change smoothly.
The easiest way to remember the difference is simple. If you count something, it is usually discrete. If you measure something, it is usually continuous.
These concepts appear in business, science, healthcare, and education. Learning them helps you analyze information more accurately.
Once you understand discrete and continuous data, statistics becomes much easier to understand.